

“Unlike chess, life moves on after checkmate.”
-Isaac Asimov
Here’s what you need to know this week:
- A review of how different Presidents do (or do not) impact the stock market
Not So Simple
We are roughly four weeks out from the 2024 Presidential election and the discourse surrounding the election is as fraught as usual. We all know the routine: candidates make bold promises and advocates prophesy gloom & doom if their opponent wins. In an environment like this, it is understandable that investors might get nervous about their investments. Today we will take a look at how markets have performed under various presidents in the past, and how presidents tend to have a smaller impact on the markets than you might imagine.
First, I’d like you to think back to the past eight years. We had four years of Trump and four years of Biden; various pundits claimed that each of them would be a disaster for the stock market. How do you think the market performed under each of them?
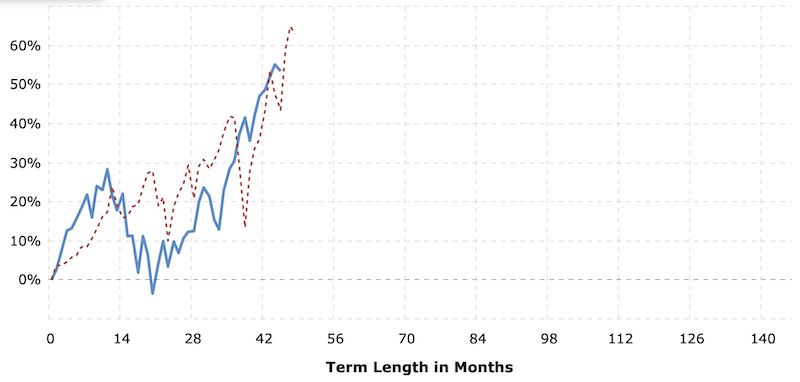
source: MacroTrends
Is this what you thought? The S&P 500 saw a 63% gain during Trump’s presidency (red line) and a 55% gain under Biden’s presidency (blue line). Trump’s tenure obviously has the edge over Biden’s, but they performed pretty similarly even despite COVID and the most intense interest rate hiking cycle in decades.
Now let’s look at a historical example. The chart below illustrates the performance of the stock market under two past presidents; can you guess who they are?
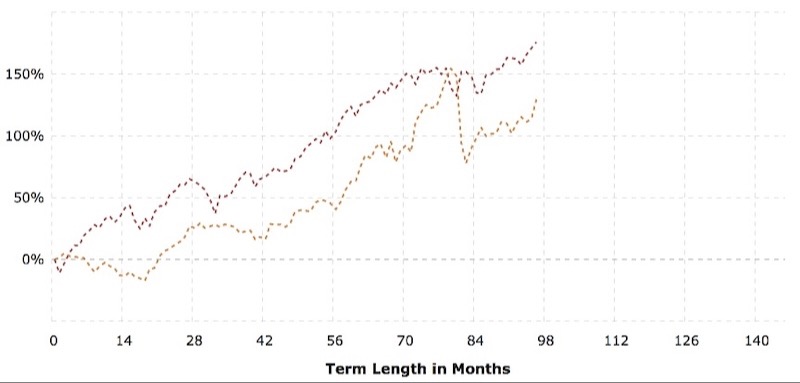
source: MacroTrends
If you guessed Presidents Reagan and Obama, hats off to you. Follow-up question: did you guess that Obama was the top line?
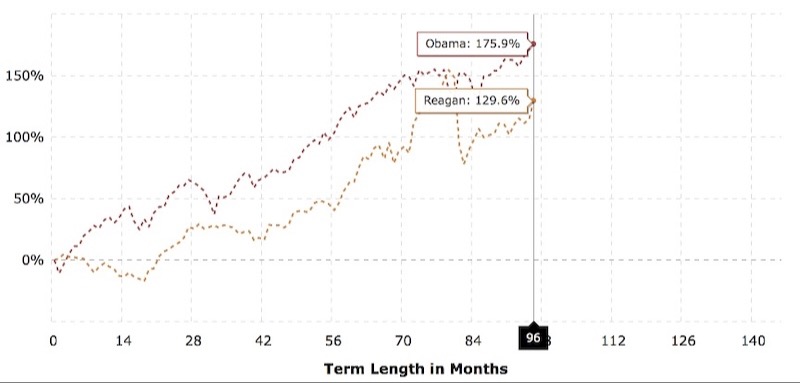
source: MacroTrends
This may seem counterintuitive; President Reagan was famously pro-business, Obama less so. Does this mean that Obama was a better pro-business president than Reagan? Not necessarily. This illustrates that economies and market cycles are complicated, and one number cannot tell the whole story. To gain a little more context, we need to zoom out:
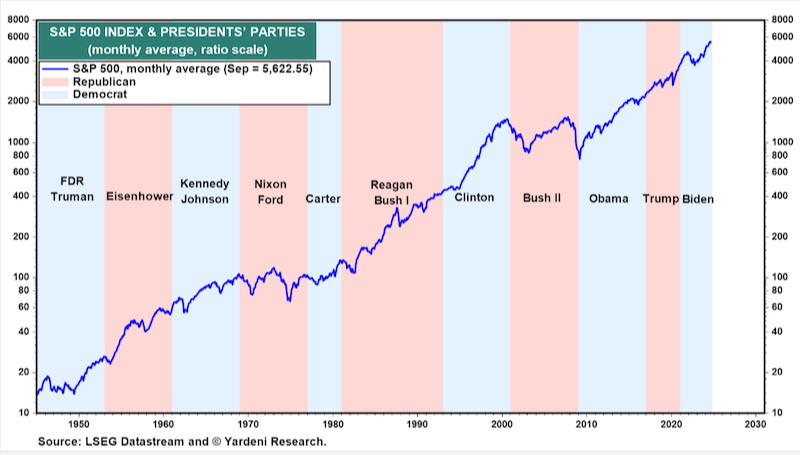
This is one of my favorite charts; it shows the performance of the S&P 500 from the end of World War 2 up to today. You can clearly see past moments of market turmoil such as the recession of the 1970s, the Black Monday flash-crash of 1987, the dot-com bubble, the 2008 Financial Crisis, the COVID dip and then recovery, and the 2022 interest rate selloff.
However, the clear trend of this chart is that stocks move upwards under both Republican and Democratic presidents. THIS is why it is so important to hold a long-term view of your investments. It does not matter if you bought the stock market at the very peak just before the 2008 Financial Crisis; if you simply held that investment until today, you would have gained more than triple your initial investment. In fact, looking at this chart, “getting out of the market to be safe” seems like the riskier option.
Some investors like the idea of only investing when their preferred political party is in power, and then pulling their investments and sitting in cash when the opposing party wins the presidency. Unfortunately, this strategy does not take the effect of compounding into account. Here is how a $100,000 investment would have performed over the past 10 years if it were invested only during Republican presidencies, only during Democratic presidencies, or invested through the entire ten years:
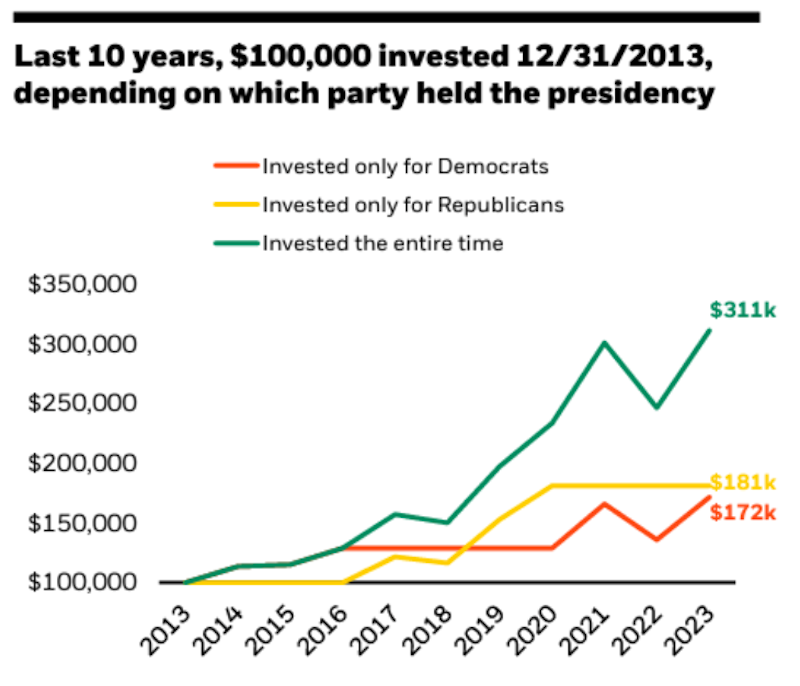
source: BlackRock
As you can see, holding for the entire ten years is clearly the best strategy. If you zoom out farther then this trend becomes even more apparent. Here is how a $1,000 investment made 70 years ago would have performed if invested only during Republican presidencies, only during Democratic presidencies, or invested through the entire 70 years:
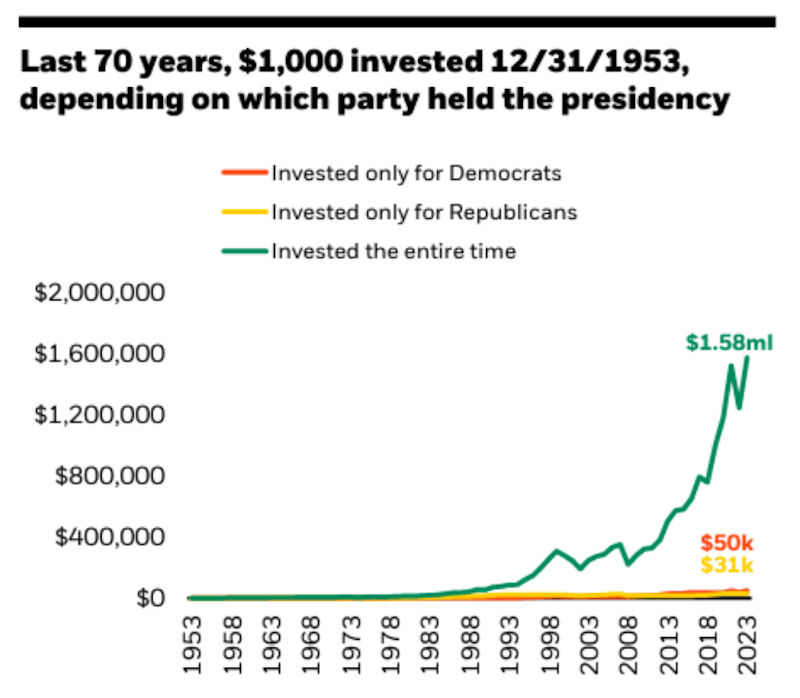
source: BlackRock
Pretty dramatic difference right? All this data points to the same conclusion: the winning strategy is not to bet on Republicans or Democrats, but instead to bet on America. America has a President, not a king (by design!) and the American economy is more powerful than any one person. The best investment advice during election seasons remains the same: tune out biased political operatives and stay focused on your long-term goals.
What Else
- The September jobs report came in hotter than expected, showing a gain of 254,000 jobs and unemployment falling to 4.1%
- The International Longshoreman Association’s strike ended after just four days, alleviating concerns of a protracted standoff at multiple US East Coast ports
- The Consumer Price Index (CPI) report for September will be released tomorrow; analysts expect to see annualized inflation at 2.3%
- Hurricane Milton became a Category 5 hurricane on Monday evening; it is expected to weaken slightly before it makes landfall in Florida tonight
- Israel has expanded its land incursion into Lebanon
- OU faces Texas in the Red River Rivalry this Saturday at 2:30 PM on ABC
- OSU is on a bye week
What We’re Reading
Tampa Bay and the western Florida coast are expecting Hurricane Milton to make landfall later this evening, and experts say this will be the strongest hurricane to hit the area in more than a century. Click below to read Tampa’s history with large hurricanes and what meteorologists expect from Milton in the coming days:
What’s Happening Downtown
Pumpkinville at the Myriad Gardens continues this week and runs through October 20th. This event features pumpkin painting, pumpkin carving, educational classes, story time and other family friendly events along with local vendors and food trucks. Tickets are $9 and is free for children ages 2 and under. Click below to learn more:
https://myriadgardens.org/events/pumpkinville/?mc_cid=a1d30bb5b1&mc_eid=71bf387036
Written by: Kane Ogle, CFP®
Steve Beck, Amber Eduvigen, CFP®, Kane Ogle, CFP®, Cale Olbert, CFP®, Brett Valentine, Brandon Ingerson, Jenni Hess, Anne Boone